ANSYS_Design_Analysis_Competition_Application
Focus
Verification of design using computational or numerical analysis using appropriate engineering tools (eg. CFD, FEA, statistical)
Requirement
Project Overview
Summary of Analyses
- Gesture recognition model
- Collect hand gesture motions for 7 different gestures -> 10 sets each’s
- 70 data samples per person for 3 people (210 total)
- Data splitting -> training set and test set 80/20%
- TPTN (true positive, true negative)
- Test cases -> measure overall
- Multithreaded system
- Reliability
- Take out sensel
Analysis Procedures (award)
- We measured the data transmission rate between the microcontroller and the PC end through the Bluetooth protocol. A low transmission rate will affect the gesture recognition accuracy, so a high rate is desired. We also measured the stability of the Bluetooth connection and the optimum transmission should be stable for hours without loss in data.
- Bluetooth 2.0 communication protocol
- C++ = driver of digital stylus
- running in driver program - measuring - data transmission rate = 280 Hertz - data transmission was stable without loss of data within an hour of running - processing time of each sample of data could match the 280 Hertz
- data was processed synchronously
- Analysis of the recognition model in general: We have 7 predefined in-air gestures: wave left to right, wave right to left, roll left to right, roll right to left, wave up to down, wave down to up, and drawing circle. We collected data from multiple users to train and test our algorithm. For each user, we collected 10 sets of the 7 gestures, so 70 data samples for each user. The gesture data samples are splitted between the training and the test set. The model is first trained on the 80% of the training dataset and uses the remaining 20% of the training dataset to validate the accuracy of the model during the training process. Once the validation accuracy stops improving, the training process is terminated. After the training is complete, the model is then evaluated on the test set. The overall prediction accuracy is measured by the percentage of predictions being the same as the test labels. Additionally, to compare the accuracy that the model performs on each gesture class, we also evaluate the prediction results with the truth table like this:
- Python
- Model takes in 600~700 samples
- ~1 second of data transmission using the wired connection
- bluetooth is ~2-3 times slower than wired connection
- input to gesture recognition model is not fixed
- can take in 300-400 or 600-700 samples as long as it is a recognizable model
- embed algo to existing driver to test the actual accuracy and user experience for the stylus prototype -> todo
- Accuracy = 100% for every single gesture meaning it is a perfect classifier
- user-specific accuracy: Our gesture recognition accuracy was analyzed on specific users. Each user has their own habit of performing a specific gesture (e.g. drawing a circle in-air) and the model adapted specific users’ gestures. In this part, we assume the user records very little data and update our gesture recognition algorithm for this user accordingly, and measure the performance on this user with more testing data from this user.
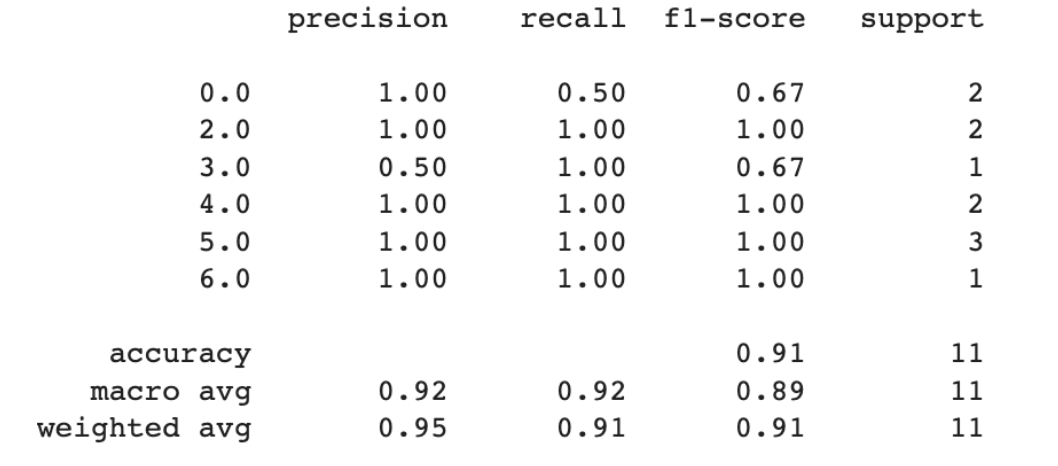
Train Data: Carson (70) + Simon (70) + Larry (14)
Test Data: Larry (56)
Result:
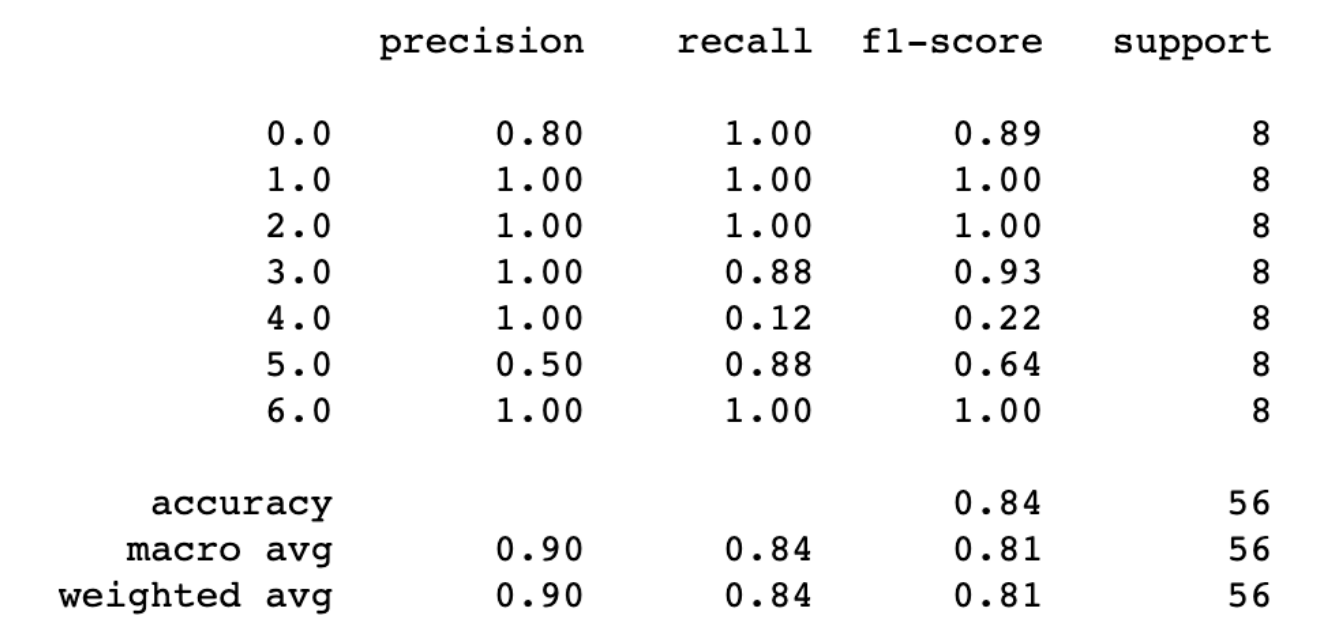 Train Data: Carson (70) + Simon (70) + Larry (21)
Test Data: Larry (49)
Result:
Train Data: Carson (70) + Simon (70) + Larry (21)
Test Data: Larry (49)
Result:
- increase larry data by 7 samples builds accuracy from 84 to 98 percent
- proves the model can easily improve the user’s habits with very few samples
- user needs only about 5 minutes to input those 21 samples
- can automatically update the model and adaptively memorize the user’s behaviour
- accuracy on new users: From a HMI (Human Machine Interaction) perspective, the model should perform considerably well on unseen users before adapting to the new user. So we constructed our recognition model using data collected by several individuals and tested it on an unseen user to measure its performance.
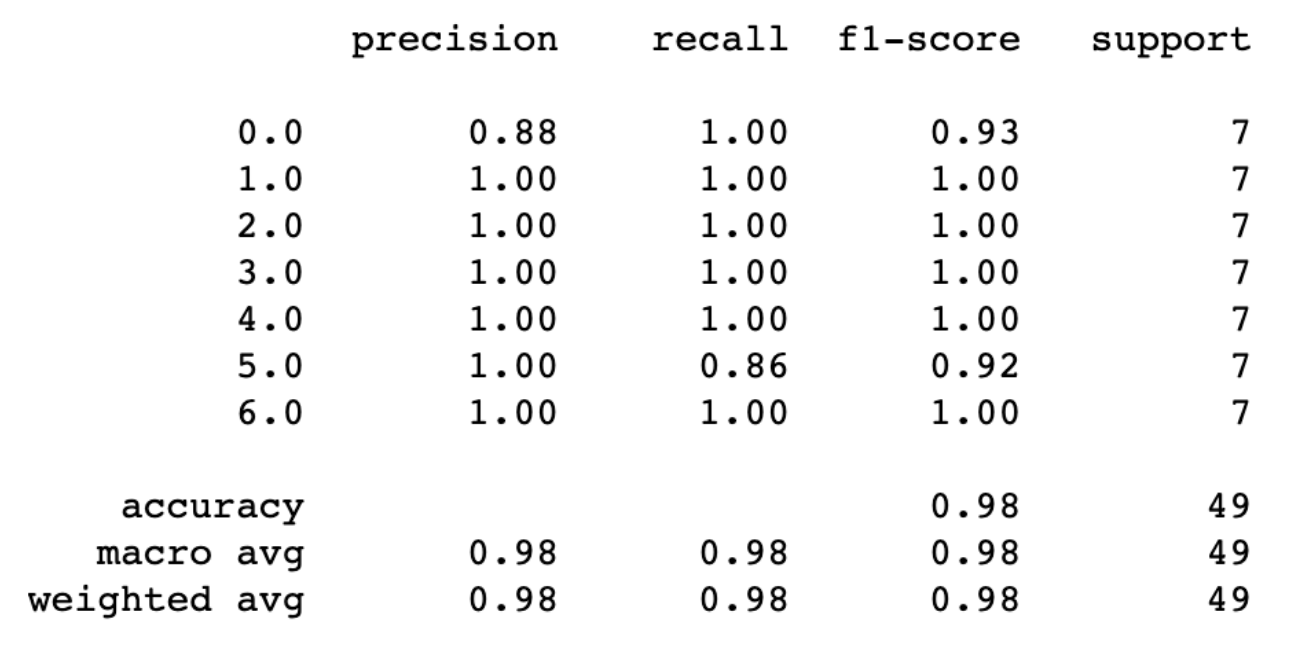
Train: Carson (70) + Simon (70)
Test: Larry(70)
Results: Model shows poor performance in class 0 (Down to Up), 3(Roll to Left), and 5 (Up to Down).
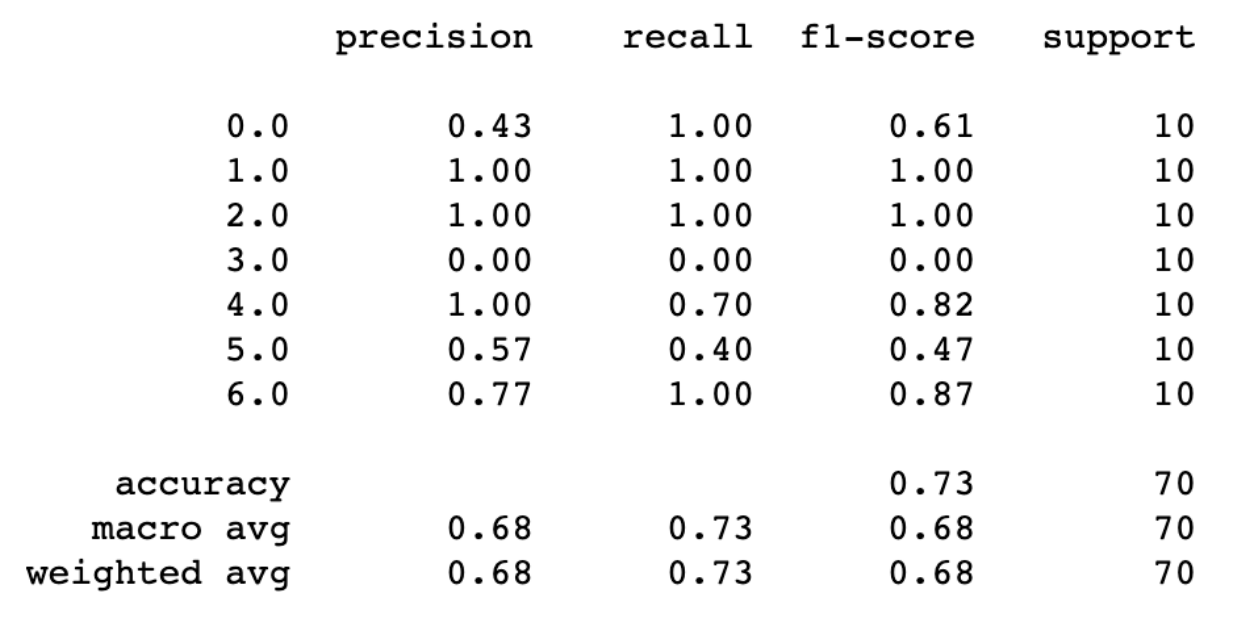
- when a new user uses the device, the model does not know the user’s habits carson and simon data tested again larry’s data -> accuracy dropped from 100 to 73%
- how the digital stylus reacts to a new user